
Beyond A/B Testing: Part 2 – When A/B Tests Struggle with Ranking & Recommendations
Why traditional experiments fall short in ranking use cases—and how Interleaving helps.


Welcome back to our series on pushing past the limitations of traditional A/B testing.
In Part 1, we explored Sequential Testing as a way to make faster, statistically sound decisions by peeking at test results in a controlled manner. But what happens when your product experience involves ranked lists or personalized content—like search results, product feeds, or movie recommendations?
This is where classic A/B testing starts to struggle. Enter Interleaving: a faster, more sensitive approach for comparing ranking systems, which can be used to pre-select the best candidates before committing to a focused A/B test.
In this blog, we’ll take a deep dive into Interleaving. Along the way, we’ll break down key concepts, practical strategies, real-world examples, and hands-on simulations you can use to understand and adopt interleaving experimentation.
⏱️Why Do A/B Tests Fail in Ranking Scenarios?
When you’re building a product that serves up ranked lists—like “Top 10 movies,” “Personalized shopping recommendations”, or “Hotel search results”—you’re not just deciding yes or no. You’re deciding the best order to show everything.
The real challenge? Comparing two different ranking systems to see which delivers the best user experience.
In a traditional A/B test, users are randomly allocated to one of the ranking systems, and their downstream engagement—such as clicks, purchases, watch time, or booking rates—is measured. However, this setup introduces major challenges:
Slow Iteration: Small improvements in ranking quality (for example, moving the “perfect product” from position #5 to position #3) might produce only subtle lifts in metrics. Detecting these tiny gains through A/B testing requires huge sample sizes—millions of impressions or clicks—to reach statistical significance. This slows down iteration cycles for ranking teams trying to optimize search, recommendations, or personalization.
High Variance: User behavior is highly personalized and session-specific. Two users exposed to the same list may behave very differently based on preferences, intent or device type. This amplifies noise in the outcome data, making it harder for A/B tests to detect true differences between ranking algorithms.
Feedback Inefficiency: A/B tests measure absolute outcomes (e.g., “Did the user click or not?”) rather than relative preferences between two ranked lists. Even if a user slightly preferred Algorithm B’s ordering over Algorithm A’s, that subtlety gets lost if both experiences led to a click. A/B tests fail to capture nuanced signals about which specific ranking provided a better user experience.
This is where Interleaving comes in.
🔬 A Bit of History of Interleaving
Interleaving was introduced in the early 2000s as a novel solution to a growing challenge in information retrieval—specifically in evaluating search engine ranking functions. Pioneered by researchers such as Thorsten Joachims at Cornell University and Filip Radlinski from Microsoft, the technique emerged as a faster and more sensitive technique compared to traditional A/B testing (Link). Their work laid the foundation for interleaving methods that allow for more efficient and nuanced comparisons between ranking systems.
Over time, interleaving moved beyond academia and found adoption at major tech companies like Netflix, Airbnb, Amazon and Walmart, especially in teams focused on ranking, recommendations, and personalization.
✨ What is Interleaving ?
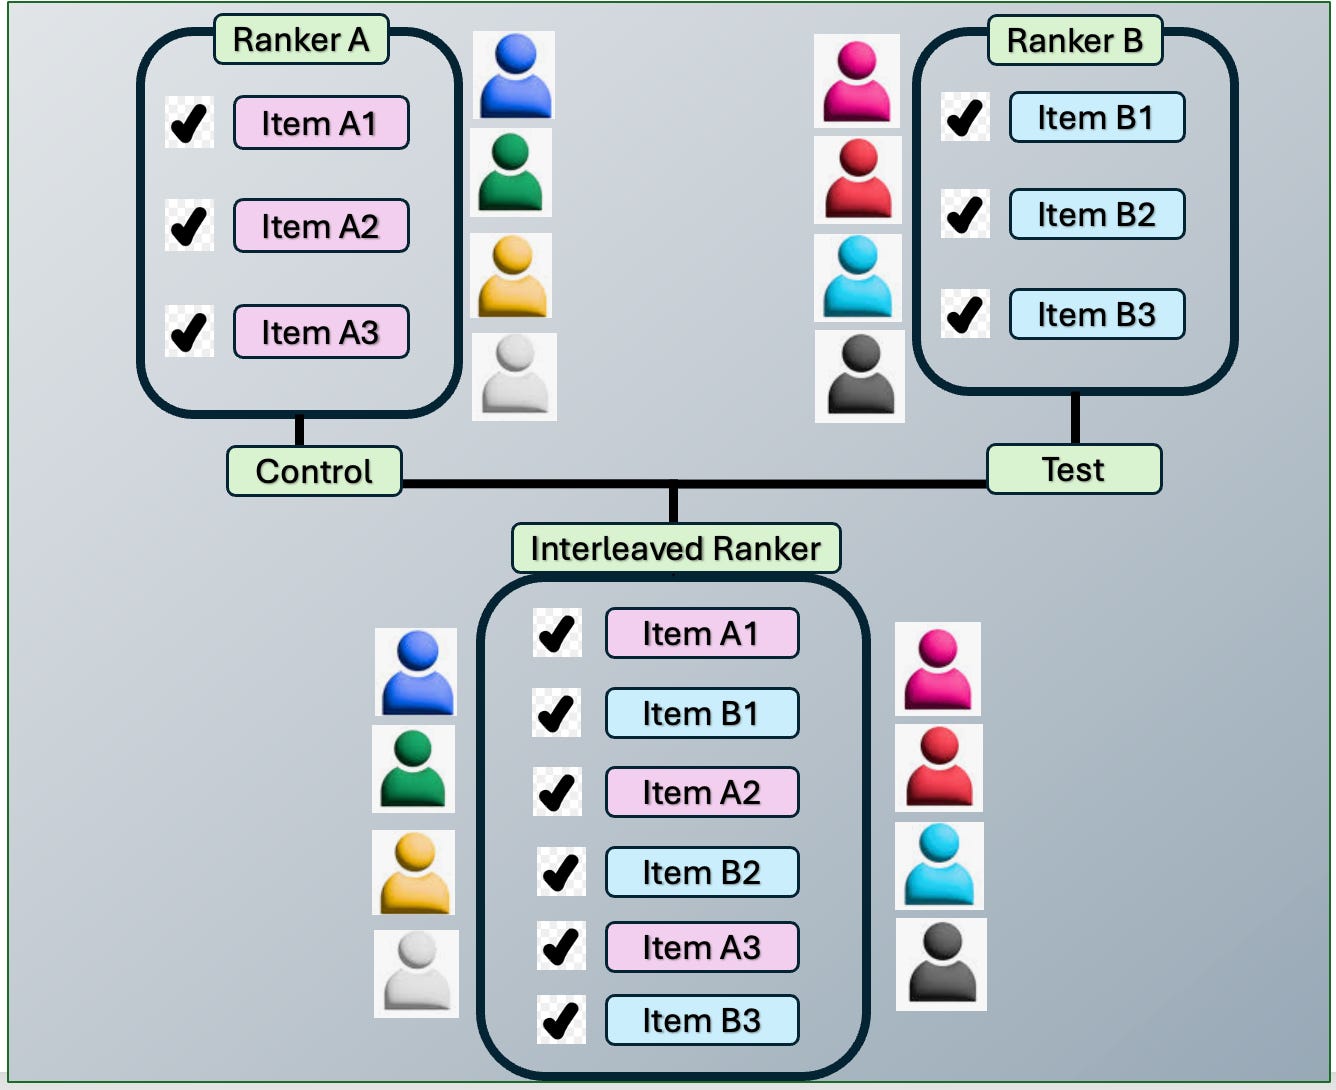
Interleaving is a technique used to compare ranking systems by blending their outputs into a single ranked list shown to the same user. Unlike A/B testing—which splits users into separate groups—interleaving evaluates multiple rank systems simultaneously by observing which rank system’s items receive more user clicks. This allows for real-time, preference-based comparisons and faster insights into which ranking method performs better.
“Imagine you’re testing two ranking models on the search query ‘Dark Chocolate.’ Each ranker is optimized for a different objective and returns the following results:”
Ranker A: Brand popularity
Ranker B: New listings
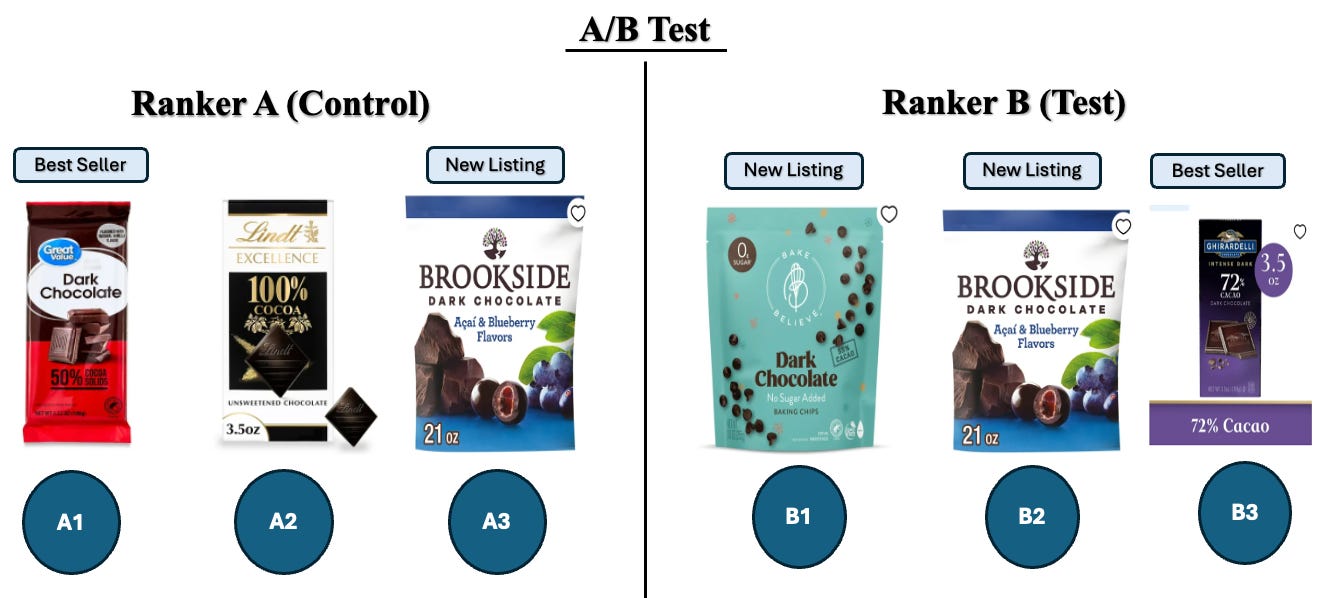
In a traditional A/B test, you’d split users: half see A’s results, the other half see B’s. But that means waiting weeks for statistically significant outcomes.
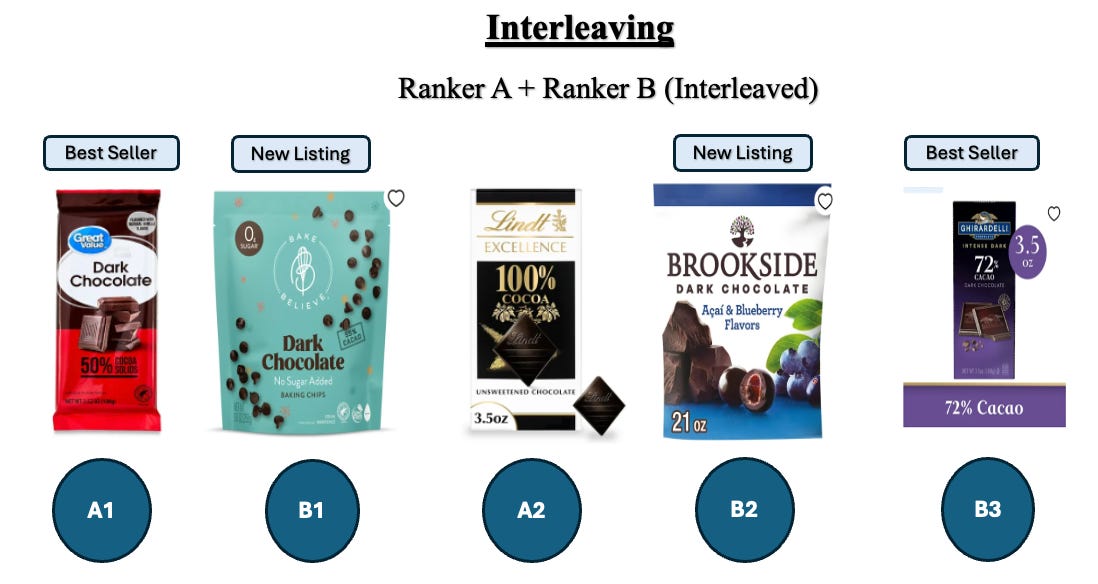
With interleaving, you mix top items from both A and B into a single list and show it to the same user. Then you track which model’s items get more clicks.
The winner? It’s whichever model captures more user engagement in real time, giving your team quicker and more meaningful business insights.
Interleaving can be extended to compare more than two ranking algorithms—such as popularity-based (Ranker A), novelty-based (Ranker B), and new listings based (Ranker C)—allowing you to simultaneously evaluate multiple approaches, whether they differ by objective.
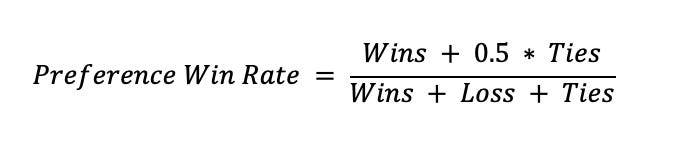
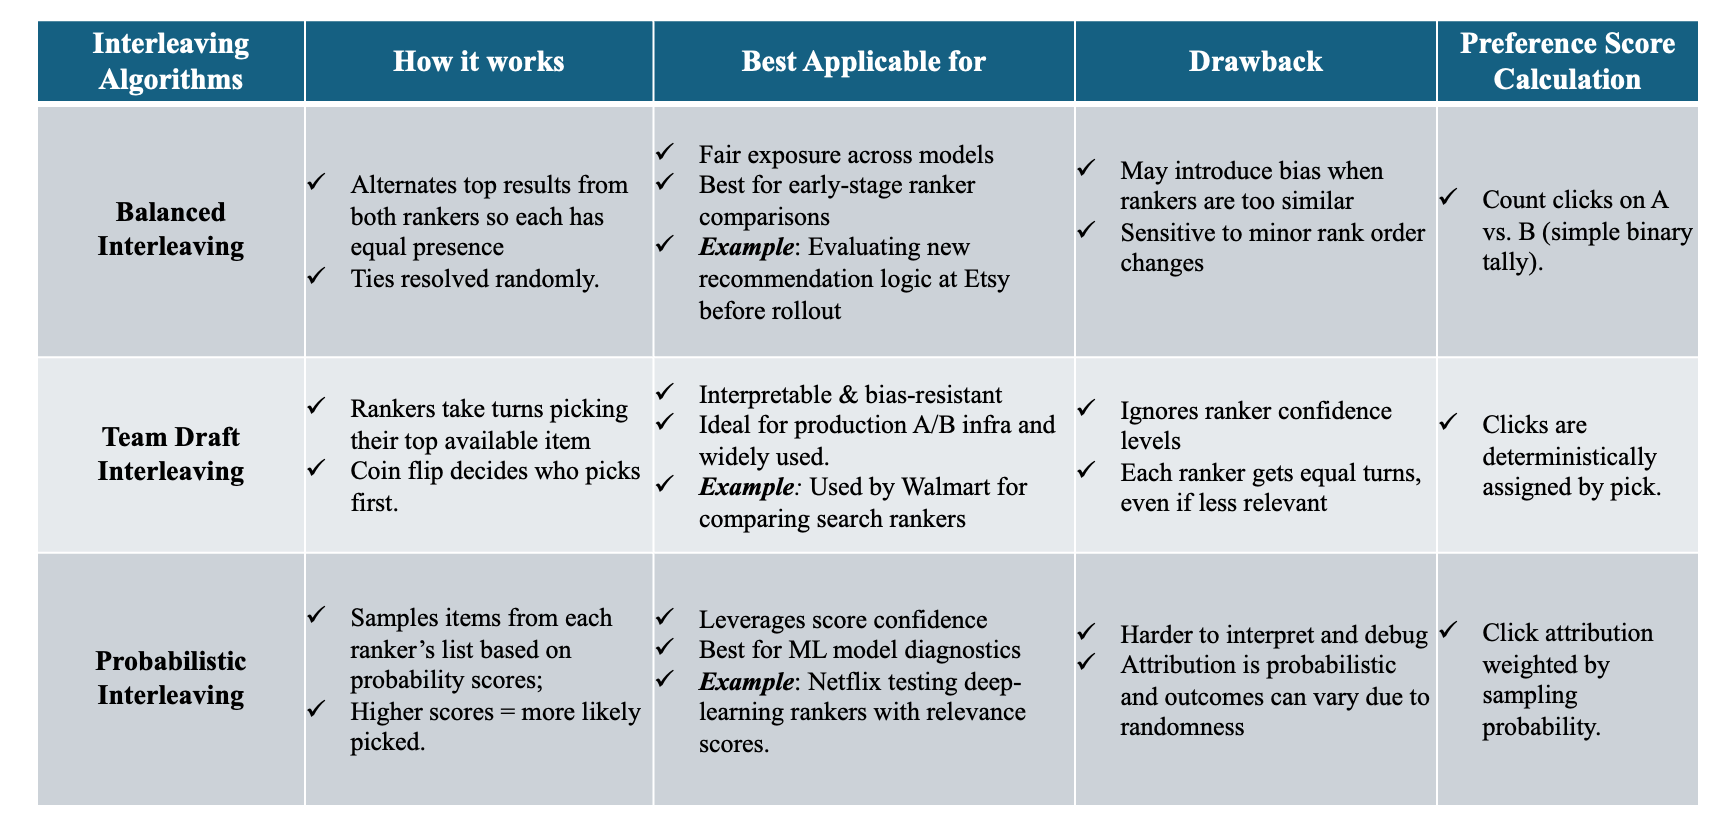
📊 Key Evaluation Metric for Interleaving: Preference Win Rate
The most common way to compare ranking systems in interleaving experiments is the Preference Win Rate (also called Preference Score). This metric measures how often items from one rank are clicked more than those from the other in the interleaved list.
How it works:
For each query or session, count which ranker contributed more clicked results.
Tally up the number of “wins” for each ranker across all queries:
Win → One ranker got more clicks
Loss → Other ranker got more clicks
Tie → Equal clicks or no clicks
Formula:

Preference Win Rate (or Preference Score) is valuable because it works consistently across all types of interleaving systems, providing a standardized way to evaluate performance. It normalizes outcomes regardless of the underlying ranking logic or the length of the result lists. Most importantly, it centers on relative user preference—the very essence of what interleaving is designed to measure.
🤖 Types of Interleaving
🧵 Interleaving Algorithm Illustration
We start with two ranking models and their outputs:
Ranker A: ['A1', 'A2', 'A3', 'A4', 'A5']
Ranker B: ['B1', 'B2', 'A2', 'A4', 'B5']
Relevance Scores:
scores_A = [0.9, 0.8, 0.7, 0.6, 0.5],
scores_B = [0.85, 0.75, 0.65, 0.55, 0.45]
Note: Some items like A2 and A4 appear in both rankers — this simulates real-world overlap when different models surface similar top recommendations but in different orders.
Output of the Interleaving Methods:
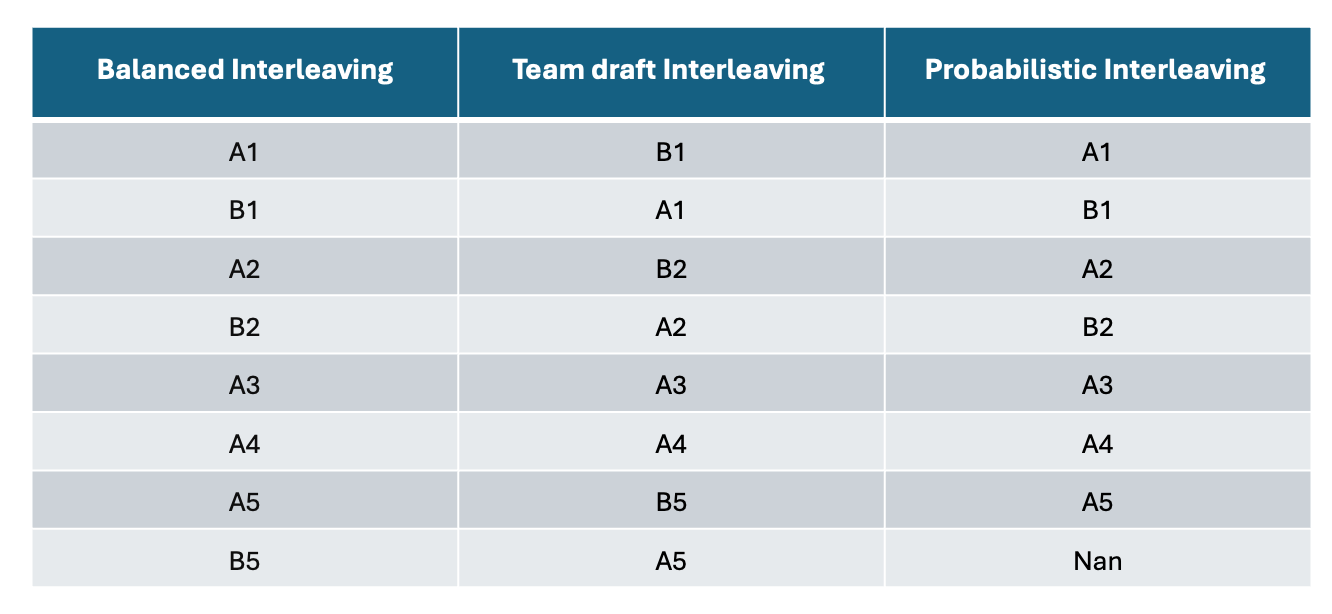
Balanced Interleaving – Output Explained
Alternates strictly between Ranker A and Ranker B (e.g., A1 → B1 → A2 → B2…).
Handles overlaps (e.g., A2, A4) by selecting from the ranker whose turn it is.
Guarantees fairness by giving equal exposure to both rankers.
Fully fills the result list by alternating until all unique items are exhausted.
Team Draft Interleaving – Output Explained
Simulates a draft where rankers take turns picking top items
Random coin flip decides which ranker picks first—in this example, it was Ranker B.
Skips duplicates: If an item is already chosen (e.g., A2), the ranker picks their next best available.
Fully fills the list with unique picks, mimicking real-world turn-based selection logic.
Probabilistic Interleaving – Output Explained
Samples items based on relevance scores (e.g., 0.9 → high priority).
Higher scores = higher chance of being shown earlier in the list.
Random sampling may skip lower-scored items (e.g., B5), resulting in missing entries (NaNs).
Models real-world uncertainty, but doesn’t guarantee full list coverage.
In summary, Balanced and Team Draft Interleaving always fill all ranks, while Probabilistic Interleaving may leave gaps if top-ranked items are exhausted. Use Balanced for fairness, Team Draft for clarity in production, and Probabilistic to capture uncertainty and model confidence.
✅ When is standalone Interleaving sufficient?
Use interleaving alone when:
You’re comparing multiple ranking systems (e.g., search, recommendation engines).
You want fast testing, focused on click-based metrics where immediate user preference is the primary signal.
You only need to evaluate short-term engagement or preference, not downstream behavioral outcomes.
🤝 Can Interleaving and A/B Testing work together?
Absolutely—the strongest strategy is a two-stage process:
Stage 1: Use Interleaving to rapidly identify the most promising algorithms with fewer users and lower cost.
Stage 2: Feed the winners into A/B Testing for robust evaluation across long-term metrics like conversion, retention, or revenue impact.
🧰 Foundational Elements for Scaling Interleaving in Your Organization
Interleaving marks a step-change in how ranking experiments are designed, run, and interpreted. Successfully implementing interleaving at scale requires more than just a methodological shift—it demands both organizational buy-in and robust technical foundations.
Think of interleaving as an efficient screening tool for your ranking algorithms: it rapidly identifies top-performing models, allowing only the best to advance to full A/B testing. This accelerates iteration, saves resources, and reduces user exposure to suboptimal algorithms.
To maximize the value of interleaving focus on building out these key components:
1. Real-Time Data Collection
Evaluate your current data pipelines and streaming technologies (e.g., Kafka, Spark) to support real-time data flows.
Enable generation of real-time ranked lists from multiple algorithms.
Develop a merging layer to combine algorithm results on-the-fly using an interleaving approach (e.g., Team Draft or Balanced).
Ensure each outcome is logged with its originating algorithm for precise preference analysis.
Attribute user clicks accurately to the correct ranking algorithm.
2. Embedded Statistical Logic
Implement statistical testing of preference scores (e.g., binomial or Z-tests) to reliably measure significance and validate results.
3. Actionable Dashboards
Build dashboards that visualize preference scores over time, segmented by user session and cohort, to provide transparency and support data-driven decisions
🎯 How to bring Stakeholders Along
Many stakeholders are used to the simple yes/no clarity of A/B tests, where each group gets a distinct treatment or control. Interleaving, by contrast, evaluates user preferences within a single session—delivering quicker feedback, but in a format that can feel less familiar at first.
How to bring them along:
Position interleaving as a pre-screen: Explain that interleaving acts as a fast filter before traditional A/B testing. By identifying the most promising ranking candidates through interleaving, you ensure only the best options move forward to full-scale A/B tests.
Reframe the win: Use intuitive metrics, like “Ranking system A was preferred 63% of the time over B,” to make results relatable and actionable.
Highlight the speed: Emphasize that what might take 6 weeks to prove in an A/B test can often be learned in just 2–3 days with interleaving.
Emphasize sensitivity: Point out that interleaving picks up on user preferences and performance differences much faster, often with far fewer users than traditional tests require.
🏢 Bonus Real-World Examples for Interleaving
🔴 Netflix – Link
Netflix leverages interleaving to accelerate iteration on recommendation algorithms—allowing them to run more experiments with fewer users while maintaining sensitivity to ranking changes.
🏡 Airbnb – Link
Airbnb implemented interleaving to evaluate ranking updates more efficiently across their search system. It helped them validate changes with smaller sample sizes while keeping the user experience intact.
Let’s dive into how you can simulate the power of interleaving yourself—with just a few lines of Python.
📊 Demonstrating the Value of Interleaving with Python Simulations
To illustrate the benefits of implementing interleaving, we can leverage Python simulations to walk stakeholders through the process. For demonstration purposes, we have organized the simulation into three parts:
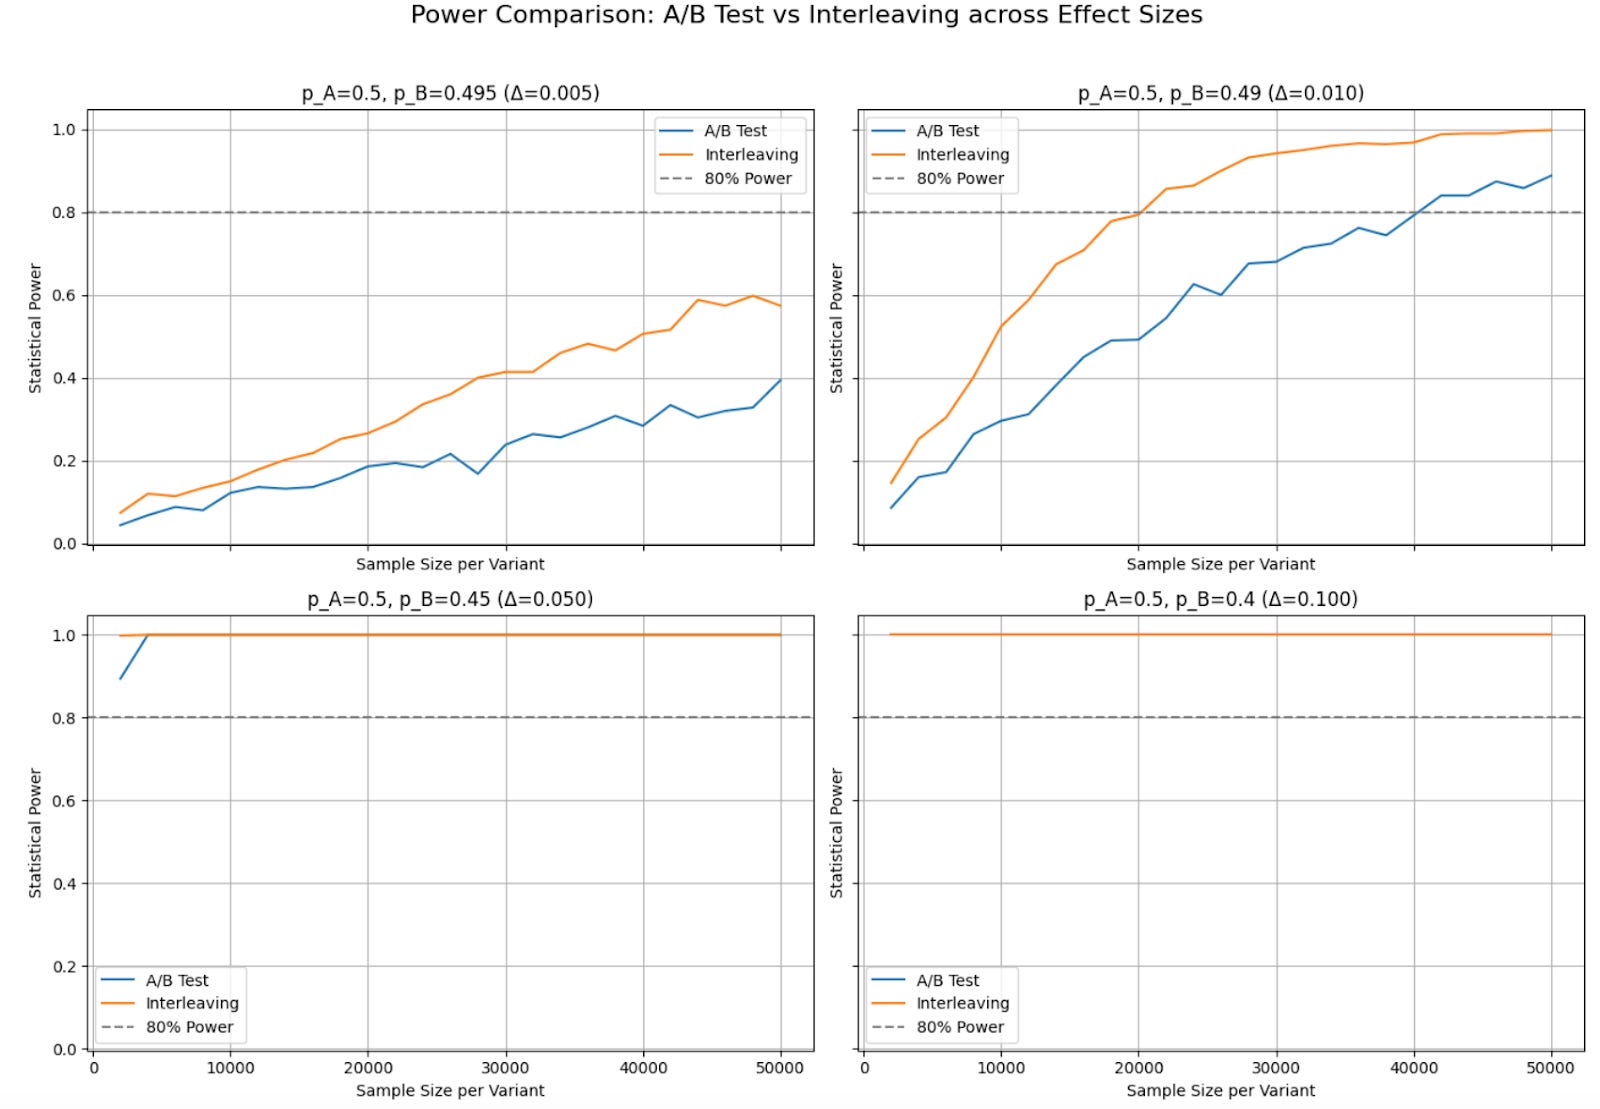
Part 1: Basic Power Comparison — A/B Test vs Interleaving
In this simulation, we compare two variants (A and B) with slightly different click-through rates—e.g., 50% vs. 49.5%—to assess how quickly A/B testing and interleaving reach 80% statistical power. A/B tests use separate user groups and a paired t-test, while interleaving assigns both variants to the same user and attributes clicks accordingly.
By repeating this process across increasing sample sizes and running 2,000 simulations per point, we estimate how quickly each method reaches 80% statistical power.
Key Findings:
Very Small Effects (Chart1, Δ = 0.005):
Neither method reaches 80% power within simulation limits, though interleaving still performs better.
Small Effect Sizes (Chart2, Δ = 0.01):
Interleaving reaches 80% power with ~20,000 samples; A/B testing needs ~40,000—almost double. In real-world industry studies, interleaving has been shown to reduce sample size requirements by 10x to 100x compared to A/B testing, especially when detecting very small uplifts.
Larger Effect Sizes (Chart3 & 4, Δ = 0.05 or 0.10):
Both methods achieve high power quickly; interleaving’s advantage narrows as signal strength increases.
In summary, Interleaving is most valuable when detecting small to moderate improvements, where A/B tests would need large samples. For larger effect sizes, both methods perform similarly. Interleaving shines when quick iteration with limited traffic is critical.
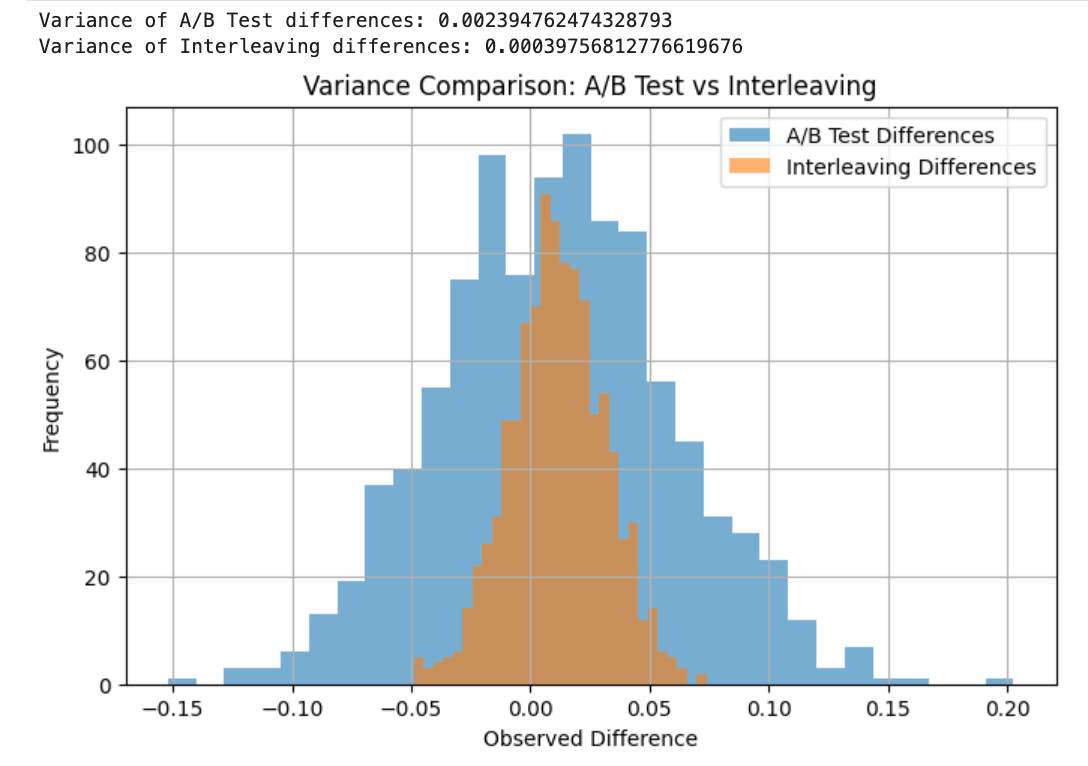
Part 2: Variance Comparison — Why Interleaving Reduces Noise
Interleaving’s speed advantage comes mainly from variance reduction. In this simulation, we compare the distribution of observed differences between A/B testing, which compares two independent groups, and interleaving, which compares differences within the same user interaction.
By simulating 1,000 samples for each method, we observe that:
Interleaving produces significantly lower variance than A/B testing.
This happens because interleaving compares two algorithms within the same user session, side by side, rather than across different groups of users (like A/B testing does).
This lower variance allows interleaving to detect small differences with fewer samples.
Part 3: Simulating Interleaving Ranking System And Preference Win rate
In this part, we simulate how two different ranking models are interleaved during an experiment, as outlined in the earlier section “Interleaving Algorithm Illustration.”
We begin by defining two ranked lists—ranker_A and ranker_B—each containing five items, along with corresponding relevance scores (scores_A and scores_B). These scores are crucial for probabilistic interleaving.
We then implement and compare three popular interleaving strategies : Balanced Interleaving, Team Draft Interleaving, and Probabilistic Interleaving. This Python simulation brings to life the table introduced earlier, demonstrating how each algorithm combines the ranked outputs.
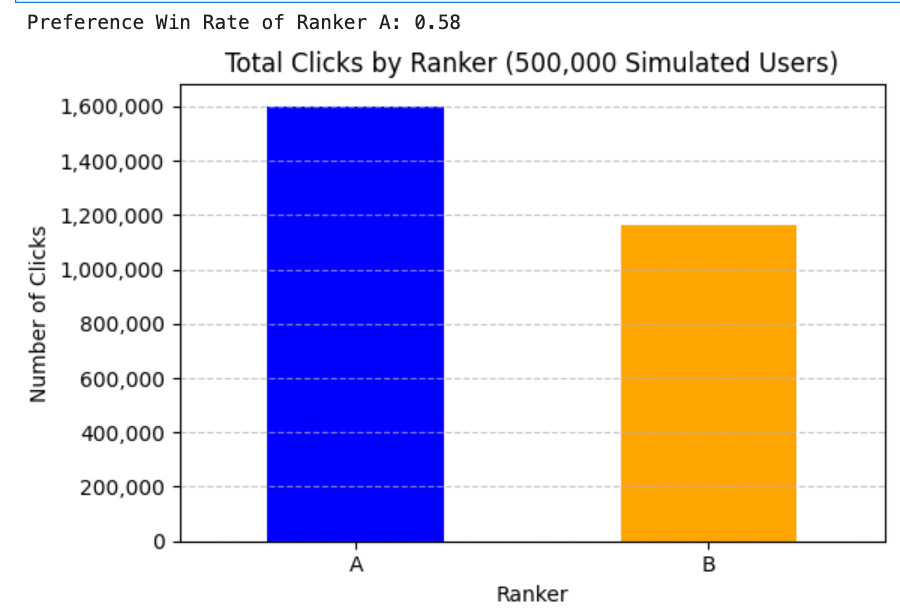
To calculate Preference Win Rate, we further simulate real-world interaction data from 500k users, focusing on Team Draft Interleaving.
Key Results:
Ranker A demonstrated stronger performance than Ranker B, achieving a preference win rate of 0.58—meaning it was favored in 58% of direct, user-level comparisons. Additionally, Ranker A generated 33% more clicks, reinforcing its ability to deliver more relevant and engaging results.
Github Code Link
🚀 Conclusion: Rethinking Experimentation for Ranking System
Traditional A/B testing has long been the standard for evaluating changes in digital products—but when it comes to ranking algorithms and personalized recommendations, its limitations become clear. High variance, slow iteration cycles, and inefficient feedback loops can significantly delay innovation. Interleaving offers a powerful alternative: by blending outputs from competing models into a single ranked list shown to users, it enables faster, more sensitive comparisons with dramatically fewer samples
Through our simulations, we demonstrated why interleaving works: it reduces variance, accelerates detection of small differences, and provides direct, session-level preference signals that A/B testing struggles to capture. We also explored how various interleaving strategies—Balanced, Team Draft, and Probabilistic—ensure fairness, attribution, and flexibility depending on the use case.
About the Writers:
Banani Mohapatra: Banani is a seasoned data science product leader with over 12 years of experience across e-commerce, payments, and real estate domains. She currently leads a data science team for Walmart’s subscription product, driving growth while supporting fraud prevention and payment optimization. Over the years, Banani has designed and analyzed 100+ experiments, enabling data-driven decisions at scale and fostering a culture of rapid, evidence-based iteration.
Bhavnish Walia: Bhavnish is a product risk manager with over 12 years of experience in finance and e-commerce. He currently leads risk management at Amazon, where he builds and scales data-driven frameworks to ensure safe, compliant product deployment. Previously at Citibank, Bhavnish led multiple experimentation initiatives, designing data science solutions that enhanced customer experience and mitigated risk.
 | A guest post by
|