


From Idea to Impact: Using Data Science to Prioritize Product Investments
Sizing a product initiative is part art, part science - and crucial for prioritization. Done right, it helps rank ideas, align resources, and focus teams on what truly drives impact.

One of the core responsibilities of a Product Data Scientist is to partner with Product Managers (PMs) to estimate the potential impact of upcoming initiatives. This work becomes especially critical during planning cycles, when PMs propose a slate of ideas aligned with annual or quarterly goals. Accurate impact sizing helps teams prioritize with confidence, balancing ambition with feasibility.
Product Initiative Lifecycle: A Collaborative Feedback Loop
The product initiative lifecycle typically follows the below progression.
Ideation & Intake
Initiatives often begin as raw ideas - sparked by user research, funnel analysis, competitive insights, or strategic priorities. PMs gather these inputs during quarterly or planning cycles.
Definition & Scoping
The product, design, and data teams come together to clarify the problem, define success metrics, and outline what’s in scope for the initiative.
Impact Sizing & Prioritization
Product data scientists help estimate potential business impact using historical data, and benchmarks. Initiatives are then stack-ranked based on expected ROI, effort, and strategic alignment.
Feature Development
Once prioritized, initiatives are handed off to design and engineering for execution. This includes wire framing, technical planning, implementation, and internal testing - often in iterative sprints with feedback loops.
Experimentation & Validation
Where possible, hypotheses are validated through A/B tests or causal inference methods. This phase de-risks major decisions before broader rollout.
Execution, Rollout & Learning
Approved initiatives move into launch phase. Post-launch, data science supports measurement, impact analysis, and derives learnings - feeding them back into the intake process to inform future cycles.
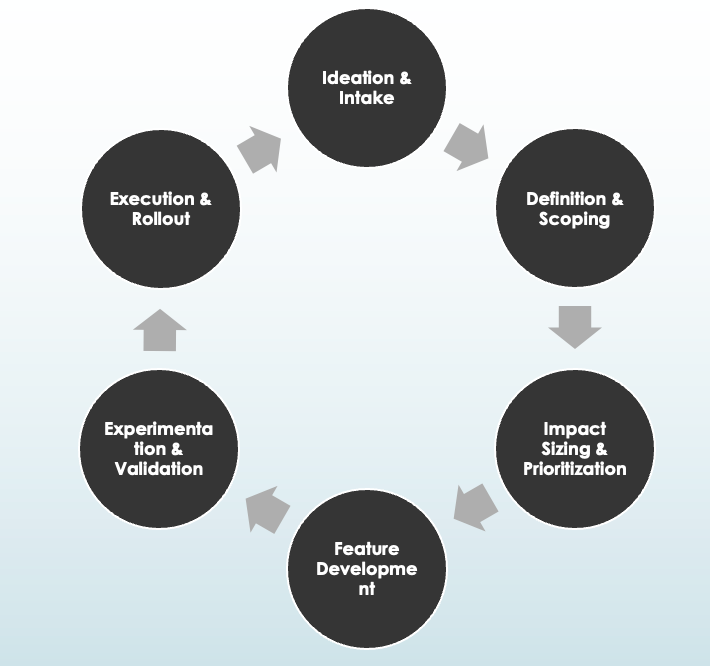
Figure: Product Initiative Lifecycle
How Do PMs Come Up with Their Intake List?
The brainstorming phase is often the most expansive. It’s not uncommon to start a planning cycle with 50+ potential ideas, especially in high-growth teams where there’s constant iteration and rapid learning. But where do all these ideas come from?
They’re typically informed by a mix of qualitative and quantitative signals, including:
User research insights – Interviews, usability tests, and surveys often surface pain points or unmet needs that spark new feature ideas.
Funnel drop-off analyses – Data showing where users abandon the journey (e.g., cart page, sign-up form) can point to high-impact areas for optimization.
Learnings from prior experiments – A failed test can be just as informative as a successful one, leading to pivots or follow-up experiments.
Customer feedback – Support tickets, app reviews, or social media mentions often hint at recurring friction points or feature requests.
Strategic plays – These include broader initiatives like entering a new market, testing alternative pricing models, or launching a seasonal promotion.
Platform investments – Sometimes the ideas aren’t visible to the user but are crucial - think performance improvements, design system updates, or reusable infra for experimentation.
For example, in a growth and subscriptions team, this can range from small nudges like updating a banner message, to more involved work like launching a new membership tier or introducing a bundling strategy for upsell. Some ideas may be fast follows from past launches, while others come from quarterly business reviews, leadership directives, or OKR alignment efforts.
In short, idea generation is rarely a problem. The real challenge lies in deciding what to pursue first - and what to leave behind.
Why Can’t PMs Just Do Everything?
If product managers had a magic wand, every idea from the intake list would ship in a sprint. But in reality, execution is constrained by multiple forces - some predictable, others not so much. Here’s what typically gets in the way:
Engineering and Design Bandwidth
Even with a full team, there’s only so much design, development, QA, and release capacity available in a given cycle. Each initiative - whether it’s updating a banner or building a new pricing module - competes for the same finite resources.
Cross-Team Dependencies
Many product ideas require support from other teams - platform, legal, growth marketing, analytics, etc. Waiting on alignment or integration from other functions often introduces bottlenecks that are outside a PM’s direct control.
Overlapping or Conflicting A/B Tests
In experimentation-heavy orgs, running multiple experiments simultaneously can cause test interference or user experience clashes. PMs may need to sequence tests carefully, which slows down throughput.
Holiday Blackouts and Code Freezes
During key retail seasons or company-wide events, no new changes are allowed. These windows are essential for stability, but they also compress available dev time and delay launches.
Shifting Priorities from Leadership
Sometimes a perfectly planned initiative is deprioritized overnight due to a pivot in business direction, an urgent bug, or a high-profile launch. PMs must be ready to re-align their roadmap mid-flight.
Varying Levels of Complexity
Not all ideas are created equal. Some are low-lift optimizations that can ship in a day, while others are full-stack overhauls requiring weeks of coordination, approvals, and testing.
In other words, it’s not about lack of ideas - it’s about making smart trade-offs. This is where impact sizing, feasibility assessments, and thoughtful prioritization frameworks come into play.
Before we dive into the next exciting part - What can PM actually do? - make sure to subscribe so you don’t miss the practical frameworks, examples, and insights coming your way!
What Can PM Actually Do?
When you’re staring at a 50+ initiative intake list, it’s easy to feel overwhelmed. That’s why the goal isn’t to do everything - it’s to do the right things first. The best way to tame this chaos is by introducing structure and stack-ranking based on impact, effort, and alignment.
Here’s the approach we’ve seen work well across product teams:
1. Standardize the Inputs
Start by converting each initiative into a common format - what’s the user problem, what’s being proposed, what’s the expected outcome?
2. Estimate Impact and Effort
Work cross-functionally (with data science, engineering, design) to assign rough estimates of:
Impact: How much it could move the business or customer metric
Effort: How many person-weeks or dependencies are involved
Strategic Alignment: Does it support a high-priority company goal?
3. Apply a Scoring Framework
Use models like ICE (Impact, Confidence, Effort) or RICE (Reach, Impact, Confidence, Effort) to assign scores. You don’t need to be hyper-precise - the goal is directionally accurate prioritization.
4. Bucket the Initiatives
Once scores are in, categorize them into two lanes:
Above the Fold: High priority, low-effort, high-alignment. These go first.
Below the Fold: Valuable, but either lower ROI or require heavy lifting. Revisit if time/bandwidth allows.
Once you’ve established a structured way to evaluate initiatives, the next question is: how do you bring data into the decision-making?
How Data Drives Decisions?
This is where product data science plays a crucial role - translating product ideas into measurable, comparable estimates that enable teams to make informed prioritization decisions. To illustrate this further, let’s consider the example of a subscription-based business.
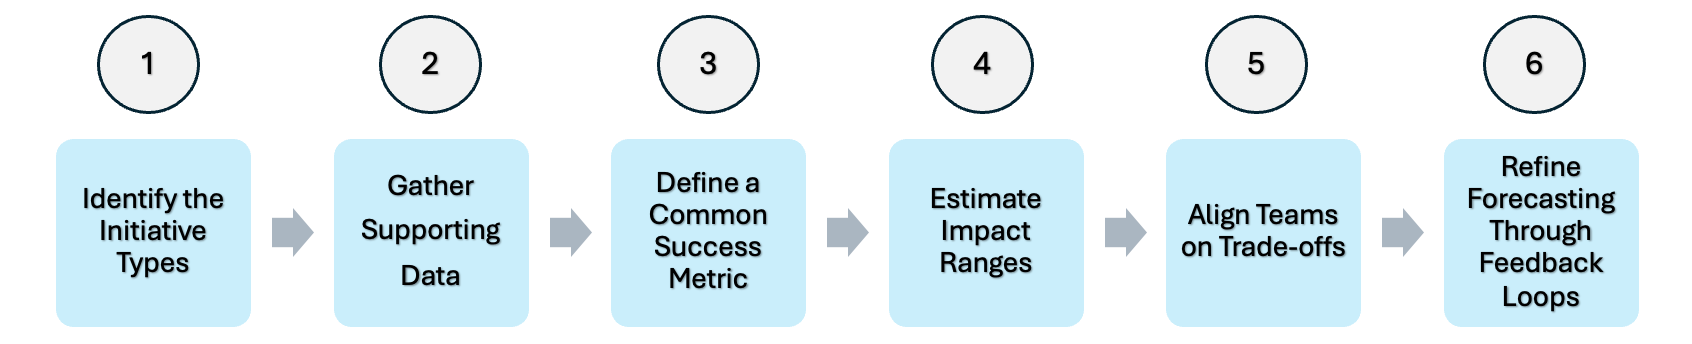
Figure: Data Decision flow
Step 1: Identify the Initiative Types
Product initiatives typically fall into a few broad categories, such as:
Feature enhancements – e.g., updated messaging or new banner placements
New features – e.g., launching an upsell module or onboarding flow
Funnel optimizations – removing friction from conversion paths
Pricing or offer experiments – designed to improve monetization
Step 2: Gather Supporting Data
To estimate potential impact, data scientists draw from multiple sources:
Historical performance baselines
Results from previous A/B tests or pilots
Industry benchmarks and published case studies
Comparable internal launches with similar goals
Step 3: Define a Common Success Metric
Each initiative is evaluated using a consistent business metric such as:
Incremental conversions
Revenue impact
Customer lifetime value (LTV)
Step 4: Estimate Impact Ranges
Instead of providing a single-point estimate, analysts frame outcomes as a range of scenarios:
Low: Conservative outcome, assuming minimal lift
Medium: Most likely case based on past data and logic
High: Optimistic but still plausible scenario
Step 5: Align Teams on Trade-offs
These impact estimates enable product, design, and engineering teams to:
Understand trade-offs
Prioritize under uncertainty
Align expectations before investing
A 10–15% deviation between projected and actual results is common - especially for new or complex launches - and is accounted for in this structured approach.
Step 6: Refine Forecasting Through Feedback Loops
After launch, actual performance data is used to:
Compare estimated vs. realized impact
Diagnose discrepancies and learn from them
Improve the accuracy of future forecasts
By grounding conversations in data-backed estimates, product data scientists help teams move from intuition to prioritization with more clarity and confidence.
Detailed Walkthrough: Estimating the Impact of a Promotional Banner
Let’s walk through how product data science helps estimate the potential impact of a new initiative - adding a promotional banner on the Cart page to encourage membership sign-ups.
Please note: all numbers and estimates provided in this walkthrough are for illustrative purposes only and may not reflect actual performance data.
Step 1: Identify the Initiative
Initiative: Place a promotional banner on the Cart page to highlight the benefits of membership.
Context:
A similar banner previously tested on the Search page delivered a +5% lift in signups.
However, placement context differs:
Search Page: Users are still exploring; lower purchase intent
Cart Page: Users are at high intent (about to purchase); greater potential to act
Step 2: Gather Supporting Data
We leverage both historical data and contextual adjustments:
Search Page baseline:
Click-Through Rate (CTR): ~1.5%
Conversion Rate (CVR) post-click: ~5%
Cart Page hypotheses:
CTR: Likely higher (2–3%) due to better placement and stronger user intent
CVR: Expected to increase due to transactional mindset and message alignment
Step 3: Define a Success Metric
We focus on incremental lift in membership signups as the core success metric.
Step 4: Estimate Impact Ranges
Using both benchmarks and contextual judgment, we create scenario-based estimates:
Low estimate (+4%):
Assumes creative execution or copy does not resonate strongly
Medium estimate (+7%):
Based on adjusted benchmarks from Search page performance
High estimate (+10%):
Assumes strong creative alignment and message timing drives maximum engagement
This range reflects execution uncertainty and provides flexibility for prioritization.
Step 5: Align Teams on Trade-offs
These estimates allow PMs, designers, and engineers to:
Understand potential ROI across scenarios
Discuss trade-offs (e.g., banner placement vs. other Cart page real estate)
Justify the opportunity cost of implementation
Step 6: Refine Forecast Post-Launch
Once the feature ships and A/B results are available, we will:
Compare actual lift to projected range
Refine future models using updated performance data
Improve estimation accuracy for similar high-intent placements in the future
Conclusion
Impact estimation is messy - but critical. It’s not about perfect prediction. It’s about enabling informed decision-making in environments full of constraints.
And next time a PM says, “Hey, can you help me size this initiative?” - you’ll have the background, approach, and intuition to say YES with confidence. You’ll know what questions to ask, what levers to pull, and how to turn ambiguous ideas into impact estimates that back up the business case.
Product Data Scientists sit at the intersection of rigor and strategy - turning fuzzy ideas into actionable, measurable bets. With thoughtful baselining, structured estimation, and a bit of stakeholder education, we help make prioritization more data-informed and outcomes more predictable.
And remember: the true power of estimation isn’t accuracy - it’s alignment.
Stay tuned for more exciting insights at the intersection of product and data science - and feel free to subscribe if you haven’t already!